Chapter 4 Miscellaneous
4.1 Missing data NaN, NA and NULL
The world tends to be messy and missing data tends to be the norm instead of the exception, R’s way of dealing with this is through defining the NaN and NA data types. NaN is more specific and used when the missing values is a numeric one, NA on the other hand is more general and cover any missing value. NA has a more broader definition, therefore NaN values are considered to be covered by NA, therefore any NaN is simultaneously NA as well. For example, the following the functions is.na() and is.NaN() are used to identify this types of data, the NaN value is recognized to be TRUE for both functions.
answers <- c("good","bad","really good","really bad","bad","really bad","good")
satisfaction <- factor(answers, levels=c("really bad","bad","good","really good"))

satisfaction[3]=NA
satisfaction[4]=NaN    # numeric not define
is.na(satisfaction)
## [1] FALSE FALSE TRUE TRUE FALSE FALSE FALSE## [1] FALSE FALSE FALSE FALSE FALSE FALSE FALSEOther important data type related with missing values is null, while it might prompt confusion, I’d like to refer to the following saying to address the difference:
NA represents the absence of presence while null represents the presence of absence
NA values can create a lot of trouble, many operations are not defined over this type of data and when apply can render a whole dataset with unusable results. This is a known issue so many functions support a mechanism for dealing with missing values, the na.rm parameter removes the missing values before the function is evaluated.
## [1] NaN## [1] 3.25Similar tricks and workarounds can be used in order to remove the missing values of a dataset, they exploit the use of logical indexing in order to remove any element that is NA.
data<- c(1:4, NA ,6:10, NaN, NA ,1 , NA, 3:6)
missing <-is.na(data)
clean_data<- data[!missing]

data2<- c(3:7, 6:10,NA ,3:1, NaN, NA,1,5 )

good<- complete.cases(data,data2)
data[good]
## [1] 1 2 3 4 6 7 8 9 10 1 5 6## [1] 3 4 5 6 6 7 8 9 10 2 1 5When working with data frames the complete.cases can be useful for handling missing values, it return a logical vector whose value are TRUE or FALSE depending if all of the elements of a row are defined and none is NA, na.omit is an alternative way to accomplish the same result, instead of returning a logic vector it directly returns the rows that does not have missing values.
##   a b  c  d
## 1 1 2 NA 21
## 2 2 3 11 22
## 3 3 4 12 NA
## 4 4 5 13 24## [1] FALSE TRUE FALSE TRUE## a b c d
## 2 2 3 11 22
## 4 4 5 13 24## a b c d
## 2 2 3 11 22
## 4 4 5 13 24There are many functions which make part of thena.x() family, which provide a rich range of responding actions when encountering with missing values, like any na.fail()``` which triggers an alert if the element contains an NA value, as well asna.contiguous()``` which identifies the longest contiguous sequence of NA values.
4.2 functions
When programming you always want to break big problems into smaller ones, and functions create the perfect container to hold each of these little pieces. R as mentioned previously is a programing language orientated towards statistical analysis therefore is has already bake in so useful functions, for example sample() can get a random sample with the specified size, by default there is no replacement but this behavior can easily be modified.
## [1] 1 3## [1] 1204.3 plot
Other useful tool that R offers and is known for is the ability to draw diagrams. Plots are a fundamental way of conveying meaningful information from a pile of data. And plots play a key role in R’s philosophy of reproducible research.
library('ggplot2')
x <- c(-1, -0.8, -0.6, -0.4, -0.2, 0, 0.2, 0.4, 0.6, 0.8, 1)
y <- x^3
qplot(x, y)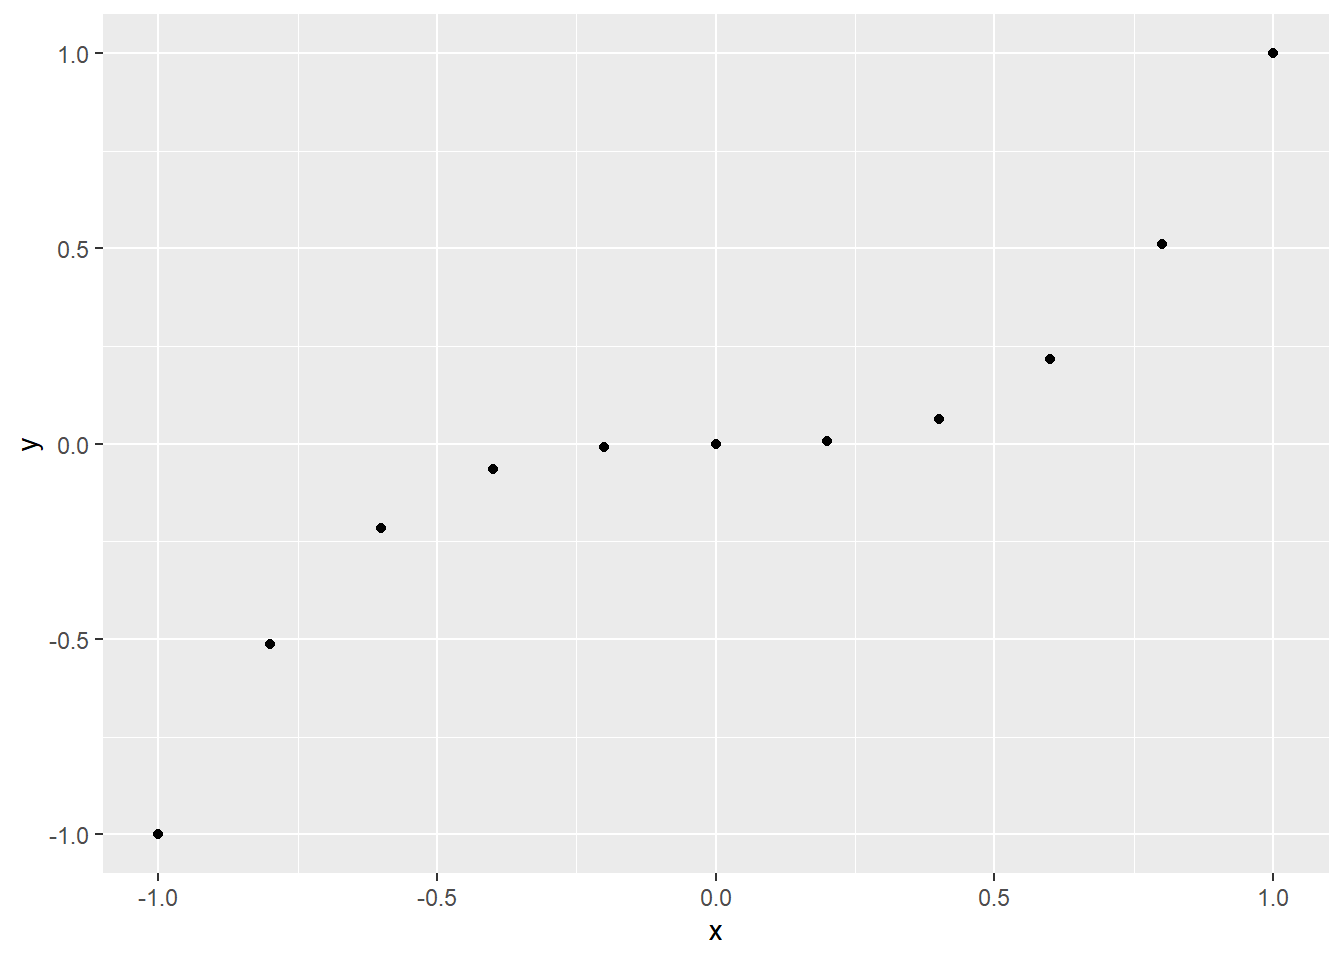
Figure 4.1: cubic function
Another great phrase
bias can easily occur without anyone noticing it in the short run.
—- Grolemund (2014)
4.3.1 practical exercise
Wickham and Grolemund (2017) shows some practical plotting examples using the tiddyverse, a collection of very useful packages for data manipulation. If you want to know more about packages you can head to the corresponding section.
We are going to use some practical data provided by the EPA (Enviromental Proteciton Agency), the mpg dataframe which makes part of the tidyverse and is used as go to introductory dataset.
4.4 R Packages
One of the advantages of open source is that the community can creates packages which extends the functionality of the core R implementation, allowing for special niche use cases to be develop and satisfy by people in that circle without being cram into the base program every body uses, it allows to have the flexibility to customize and pick the tools needed while tapping into the work done by a large community of people. There exist many ways to access this packages, the larger collection is provided via the CRANN repository but Git based packages are also supported. In order to use any external package it is necessary not only to install it, but also to load it into the R environment.
- CRAN based package: CRAN (Comprehensive R Archive Network) is an collection that holds documentation and code related to R. It stores many R packages which have the advantage that they can be install directly via the
install.packages(" ")command making it extremely easy to incorporate new packages into a project. For example in order to install thetidyversepackage collection the following command can be use:
Once installed the library() command can be used to load the packages into R. Notice that install.packages() gets an argument between quotes but library() does not.
Note: It is important to note that in order to install some packages, the ones who have c/c++/fortran source code instead of the binary, they need the rtools in order be build, and the rtools must be compatible with the R version.
- Git based package:
Note: packages needs to be loaded every time Rstudio is loaded. The following commands show you the loaded packages, and in the case you need to unload a package the detach command can be helpful.
Usually when dealing with a new package you want to know what is inside what dataset, functions or functionalities it provide, the help command ? can be use to explore the package documentation and get a better idea of what it contains. The following example allows to explore the datasets package, an built-in package that store some useful datasets.
The following is a list with some of these datasets:
AirPassengers           Monthly Airline Passenger Numbers 1949-1960
BJsales                 Sales Data with Leading Indicator
BOD                     Biochemical Oxygen Demand
CO2                     Carbon Dioxide Uptake in Grass Plants
ChickWeight             Weight versus age of chicks on different diets
DNase                   Elisa assay of DNase
EuStockMarkets          Daily Closing Prices of Major European Stock Indices, 1991-1998
We can take a look into some of this datasets
##          DAX    SMI    CAC   FTSE
## [1,] 1628.75 1678.1 1772.8 2443.6
## [2,] 1613.63 1688.5 1750.5 2460.2
## [3,] 1606.51 1678.6 1718.0 2448.2
## [4,] 1621.04 1684.1 1708.1 2470.4
## [5,] 1618.16 1686.6 1723.1 2484.7
## [6,] 1610.61 1671.6 1714.3 2466.8## [1] 112 118 132 129 121 135## weight Time Chick Diet
## 573 155 12 50 4
## 574 175 14 50 4
## 575 205 16 50 4
## 576 234 18 50 4
## 577 264 20 50 4
## 578 264 21 50 44.4.1 create your own package
There are many things to consider when thinking about building a package.
Why packages are important?
- Code organization
- Consistent documentation
- Code distribution
why am I creating a package? It is about code distribution,
For me I am not planning on creating some useful code to mankind -not yet-, I want to create an example package that will in the basics of package creation and would allow my to access some custom scripts across different computers, and want to configure all the needed dependencies.
## Loading required package: usethishere::dr_here()
or to make it permanent use the function install
minimum viable product — it’s best to get a project started and improve it through iteration
Never use library() or require() in a R package!
4.5 Read info with read table
Data can be produce in different forms, it can be structured or unstructured, regardless of the format, being able to interact with this data and organize it in a useful manner is an important process that needs to be done, so it can be feed to upcoming analysis. this process of organizing the data is known as pipelining (to learn more about this process feel free to check the Data collection module ).
Some common formats for data storage are csv (Coma Separated Values) files, R has some built in function for reading this type of files through the read.csv() or read.table(). Here is an examples of some students data read from an csv file. These function have some parameters that help to specify the behavior we want it to have. For example one can determine what symbol would be used as separator or either if the file has headers or not. for more info on other supported arguments please read the documentation. One thing to be aware when dealing with large dataset is RAM, if the dataset is larger than the RAM memory capacity it will create troubles.
initial <- read.csv("../data/student_info.csv",sep=";",header=TRUE, nrows=100)
classes<- sapply(initial,class)

students <- read.table("../data/student_info.csv",sep=";",header=TRUE, colClasses = classes)
print(students)
## Name.and.Lastname ID email.adress
## 1 Samuel Jackson 10124585611 samuelJ@mail.com
## 2 Robert Downey 4525111559 rdownironman@mail.c
## 3 Douglas Adams 14884674721 zaphodbeeblebrox@mail.com
## 4 Stephen Wolfram 74682868914 wolframalpha@mail.com
## 5 Cleve Moler 17463589721 chiefmathematician@mail.com
## 6 Matt Parker 18457956247 parkersquare@mail.com
## 7 Brady Haran 17694858874 numberphile@mail.com
## 8 Emily Graslie 17973595287 brainscoop@mial.com
## 9 Derek Muller 17954965491 veritasium@mail.com
## 10 Destin Sandlin 17895782879 smarter@mail.com
## 11 Freddy Vega 17795795697 fredier@mail.com
## 12 Stanislaw Lem 19748659471 golem@mail.com
## 13 Isaac Asimov 13589844557 robots@mail.com
## 14 Susan Calvin 47958446526 susan@R_MM_Inc.gov
## 15 R Daneel Olivaw 10001110101 dolivaw@mail.com
## 16 Elijah Baley 97565841047 lijahbaley@mail.comHere is a second example where one displays the lasts elements of the file.
##     face   suit value
## 48  five hearts     5
## 49  four hearts     4
## 50 three hearts     3
## 51   two hearts     2
## 52   ace hearts     1
When working with large data sets specifying the data type by the parameter colClasses, can optimized and reduce the time needed to process the data.
4.6 week assignment
As part of these week’s assignment it was optional to do the following swirl practices. swirl (Statistics with Interactive R Learning) is a R package develop to allow students to learn by interacting directly with the command interface. In order to use it one needs to install the swirl package see.
References
Grolemund, Garrett. 2014. Hands-on Programming with R. O’Reilly. https://rstudio-education.github.io/hopr/index.html.
Wickham, H., and G. Grolemund. 2017. R for Data Science. O’Reilly Media. https://r4ds.had.co.nz/.